Process
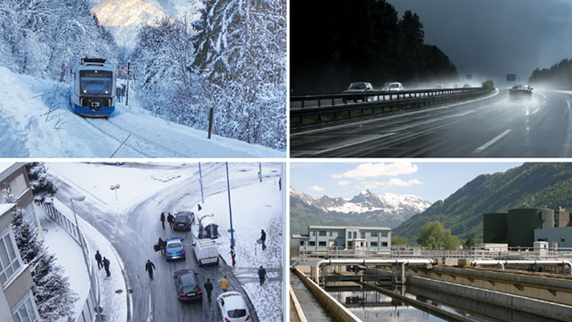
A recent project commissioned by the European climate data supplier - Copernicus Climate Change Service (C3S) - saw the IEA and several European partners using the C3S Climate Data Store, an online repository of climate data, to try to address these questions using five use cases where infrastructure design might be impacted by climate change: (i) long term design and planning of roads in Spain (ii) climate change adaptation in railway infrastructure planning in the Netherlands/UK (iii) a climate stress-test for urban infrastructures in the city of Amersfoort, the Netherlands and Basque municipalities, Spain (iv) design of power station and district heating in Vitoria, Spain and (v) water and sewage infrastructure management in Rome.
During the project, feedback from industry partners regarding data presentation, structure and areas of uncertainty were taken into account and used to improve documentation around datasets. For example, while daily data can be provided, it was made clear that the output of the model for a certain date in the future is not a forecast for that day.
Solution
Our analysis found that the large uncertainty that exists in the future projections of extreme events, the inherent limitations and inadequacies of climate models and the need for very high-resolution data (due to the local features of a site being of utmost importance) often limit the possibility to feed climate model data directly into standards. This means there is currently an absence of simple, practical examples of climate projections being used to design and operate infrastructure. The project tackled this by highlighting a number of case studies and by providing improved documentation to guide activity.
Impact
The project aimed to provide a realistic, traceable and robust methodology for dealing with climate models of all types, signposting users to sources of climate data that are well referenced. Whilst the project focused on Europe, the lessons and outcomes are equally applicable to other regions. Work was also undertaken to communicate with standards bodies such as the European standards organisations (CEN-CENLEC) to highlight the complexities of using climate data and how to start renewing it into standards.
Tell us about your data challenge